
The TikTok Playbook: Cracking the Code to Viral Engagement
**Visit my GitHub for project details, code, queries, and documentation.
Business Problem and Objectives:
This project aims to analyze the key factors driving video engagement on TikTok, including views, likes, shares, and comments. By examining video duration, posting time, transcription sentiment, and verification status, the goal is to uncover patterns that can help creators and marketers optimize their content for better engagement.
The analysis also explores how these variables interact, providing insights into the most effective combinations for success. This framework sets the stage for future A/B testing and further optimization of promotional strategies.
Summary of Analysis:
This analysis looks at how different video features—like length, posting time, sentiment, and verification status—impact engagement on TikTok. We explore how these factors work together to influence views, likes, and shares, and also use models to predict which videos might go viral early on. By identifying videos that perform much better or worse than expected, we gain insights into what makes certain content stand out.
Finally, we propose an A/B test to evaluate how specific strategies can boost engagement, offering practical steps for improving video performance on TikTok.
How Long is Too Long? Finding the Optimal Video Length for TikTok Stardom
This analysis investigates whether video length significantly impacts TikTok engagement metrics, such as views, likes, and shares. By analyzing data across different length categories (0-10 sec, 11-30 sec, 31-60 sec) using visual and statistical methods, we aim to determine if video length is a key driver of engagement, or if other factors such as content quality and timing play a larger role.
Exploratory Data Analysis (EDA): Understanding Engagement Metrics Distribution:
We first explored the distribution of key engagement metrics (views, likes, shares) to understand the patterns across different video lengths. The histograms showed non-normal distributions across all metrics, prompting the decision to use the Kruskal-Wallis test to compare medians across the three video length categories.
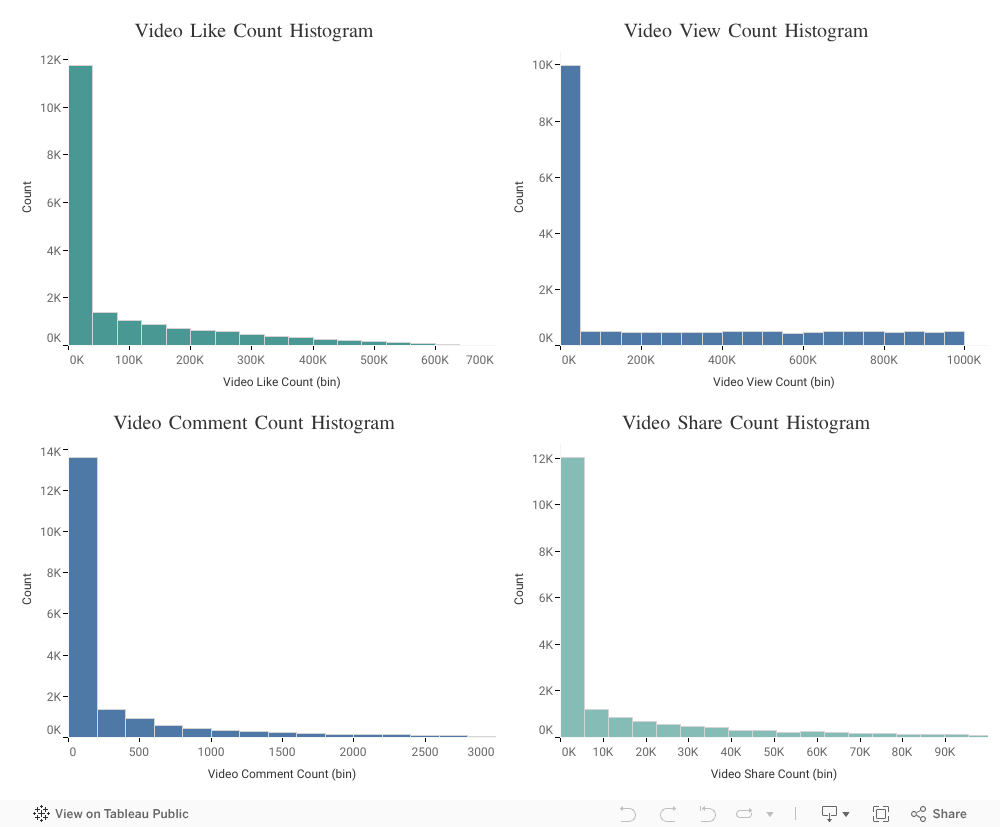
Test Selection: Why Kruskal-Wallis Test Instead of ANOVA?
As shown in the histograms above, engagement metrics such as video views, likes, shares, and comments are not normally distributed. Since ANOVA assumes normality, the Kruskal-Wallis test, a non-parametric alternative, was used to compare the medians of engagement across the three video length categories (0-10 sec, 11-30 sec, 31-60 sec). This approach allows us to accurately assess differences without violating statistical assumptions.
Running the Kruskal-Wallis Test
Given the non-normal distribution of engagement metrics, the Kruskal-Wallis test will be used to compare the median engagement (views, likes, shares, comments) across the three video length categories. This non-parametric test provides a robust alternative to ANOVA, allowing us to examine whether video length significantly influences engagement without relying on normality assumptions.
Key Hypotheses:
Null Hypothesis (H₀): The median engagement is the same across all video length categories.
Alternative Hypothesis (H₁): The median engagement differs between video length categories.
Visual Hypotheses Anlaysis:
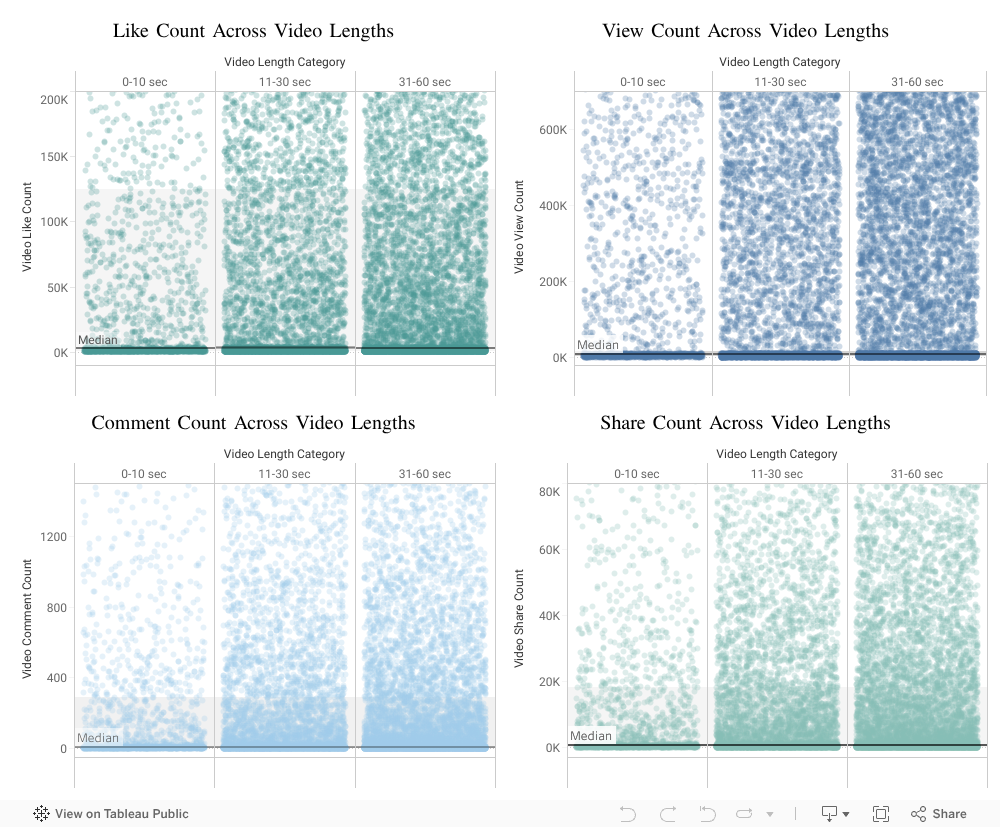
The jitter plots reveal that engagement spread is more compact for shorter videos (0-10 sec), indicating more consistent performance, while longer videos (31-60 sec) show greater variability. Despite this variability, the median engagement remains similar across all length categories. While longer videos are more popular, this does not result in significantly higher engagement, and engagement outcomes are proportional across all lengths.
Interpretation
Distribution and Spread: The spread of points within each category varies. Shorter videos (0-10 sec) show a more compact distribution around the median, indicating consistent engagement. In contrast, longer videos (31-60 sec) show a wider spread, suggesting greater variability in engagement. This means that while some longer videos perform extremely well, many others have lower engagement, resulting in more dispersed outcomes.
Video Count and Popularity: There are more videos in the longer length categories, which contributes to the observed spread. While there are more longer videos, this does not correspond to higher engagement. Instead, the engagement remains proportional across all video lengths, meaning the number of videos doesn’t translate to higher or lower engagement based on length alone.
Median Line: The median line for each video length category shows that the central tendency of engagement metrics is very close to zero, with no dramatic differences between categories. This confirms that video length does not significantly impact median engagement.
Lack of Outliers: The consistent distribution with few outliers suggests that video length does not result in extreme performance differences. Engagement for both short and long videos remains relatively proportional, with no one length consistently outperforming others.
The Kruskal-Wallis test resulted in an H-statistic of 2.32, with a corresponding p-value of 0.31. Since this p-value exceeds the significance threshold of 0.05, we fail to reject the null hypothesis. This means that the differences in engagement across video length categories are not statistically significant.
H-statistic: 2.32
p-value: 0.31
Conclusion:
This confirms what we observed in the jitter plots—video length does not significantly impact key engagement metrics like views or shares. The data suggests that factors other than video length (such as content quality or timing) may play a larger role in driving engagement on TikTok.

Test Results: Kruskal-Wallis H-statistic and p-value
To assess whether video length significantly impacts engagement, we used the Kruskal-Wallis test, a non-parametric method ideal for comparing medians across non-normally distributed data. The test compared engagement metrics (views, likes, shares) across the three video length categories.
Conclusion and Key Insights
The results of the visual analysis and Kruskal-Wallis test confirm that video length (0-10 sec, 11-30 sec, 31-60 sec) does not have a statistically significant impact on engagement metrics (views, likes, shares, comments).
No Significant Difference: Both the visual distribution and statistical test show that engagement remains relatively consistent across video length categories, with no significant advantage for any specific length.
High Variability: While engagement is more variable for longer videos, this does not result in significant differences in median engagement. The larger number of longer videos contributes to this variability, but it does not imply higher engagement.
Actionable Recommendation
Based on these findings, creators should shift focus away from video length as a primary strategy. Instead, they should:
Prioritize Content Quality Over Length:
Recommendation: Enhance TikTok's recommendation algorithm to focus on early engagement signals (initial likes, shares, completion rates) rather than video length.
Business Impact: This will increase user retention and time spent on the platform, leading to higher ad revenue.
Use Predictive Analytics for Ad Placement:
Recommendation: Implement predictive tools to identify videos with high early engagement for prioritized ad placement.
Business Impact: Maximizes ad revenue by placing ads in high-performing content based on early success signals.
A/B Test for Peak Engagement Times:
Recommendation: A/B test posting and promotion times to identify peak user activity periods and boost content accordingly.
Business Impact: Increases engagement rates and ad effectiveness by promoting content when users are most active.
2. Blue Check Magic: Do Verified Accounts Always Get More Engagement?
On TikTok, the blue checkmark is often perceived as a fast track to stardom. But does verification actually enhance engagement? This section compares verified and non-verified accounts to determine if the blue check significantly impacts engagement metrics such as views, likes, shares, and comments. We aim to uncover whether verification status is truly a key to success or merely a minor enhancer.

Note on Determining "High Performing" Videos:
Before moving on, let’s clarify how "high performing" videos were identified: We categorized videos as "high performing" based on having at least one engagement metric (views, likes, shares, comments) in the top 25th percentile compared to all other videos. This criterion ensures that our definition of performance captures videos that excel in any key area of engagement.
The Fisher's Exact Test
In this analysis, we utilized Fisher's Exact Test to examine if a verified status on TikTok correlates with better engagement. Unlike the more common Chi-square test, Fisher's is ideal for data with significant imbalances in sample sizes, as it provides exact p-values from the hypergeometric distribution, perfect for our dataset where verified accounts are far fewer than non-verified ones.
The p-value resulting from Fisher's Exact Test will tell us whether the differences observed in the engagement levels between verified and non-verified accounts are statistically significant. Specifically, a low p-value (typically <0.05) would indicate that there is a statistically significant association between verification status and engagement level, suggesting that the verification status has a real effect on engagement. Conversely, a high p-value would suggest that any differences in engagement could likely be due to random chance, implying that verification status does not significantly impact engagement.
Fisher’s Exact Formula:

Test Results:
After performing Fisher's Exact Test on the engagement data between verified and non-verified TikTok accounts, we obtained a p-value of less than 0.00001. This extremely low p-value indicates that the differences in engagement levels between verified and non-verified accounts are statistically significant.
The significant p-value suggests that having a verified status on TikTok is associated with different engagement outcomes compared to non-verified accounts. Specifically, our analysis shows that non-verified accounts tend to have a higher proportion of high-engagement videos than verified accounts. This finding challenges the common perception that verification necessarily leads to higher engagement and suggests that factors other than verification, such as content quality, creator-audience interaction, and topic relevance, might play more critical roles in achieving high engagement on the platform.
Visual Analysis:
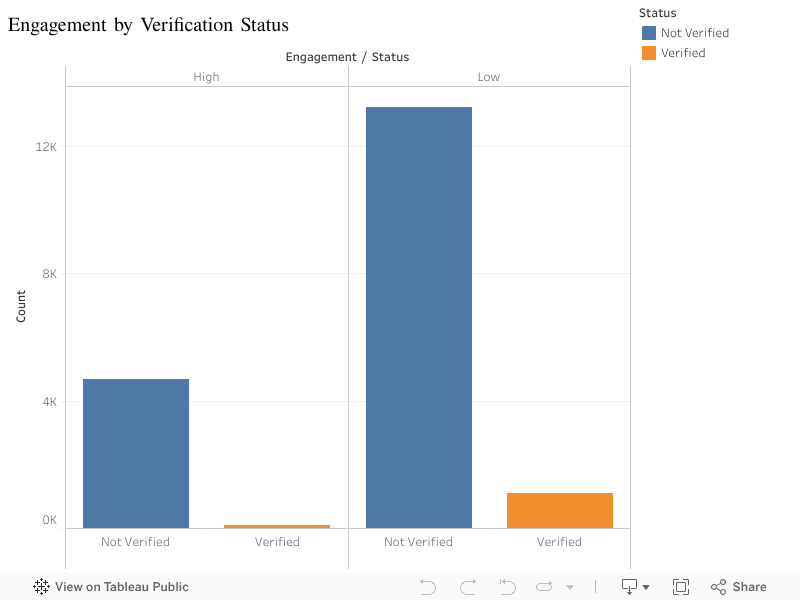
The data shows that non-verified accounts have a higher proportion of high engagement compared to verified ones. This challenges the notion that verification alone boosts visibility and engagement. Instead, it suggests that TikTok users prioritize content quality and relevance over account status.
For creators and marketers, this means that focusing on authentic, engaging content can yield better results than relying on verification. TikTok's algorithm appears to promote content based on engagement rather than simply giving preference to verified accounts, highlighting the importance of interaction-driven content strategies.
Conclusion
The results of the Fisher's Exact Test indicate a statistically significant difference in engagement between verified and non-verified TikTok accounts. Surprisingly, non-verified accounts show higher proportions of high engagement compared to verified accounts. This challenges the common belief that verification automatically drives better engagement.
Key Takeaway: Verification status alone does not guarantee higher engagement; content quality and audience interaction are more influential factors.
Strategic Recommendations
Prioritize Engagement Metrics Over Verification:
Recommendation: Creators and marketers should focus on building content that generates high engagement through quality and relevance, rather than relying on verification status alone.
Business Impact: This approach will help creators increase engagement and foster stronger connections with their audiences, leading to improved campaign performance for marketers.
Algorithm Optimization for Content Discovery:
Recommendation: TikTok can refine its recommendation algorithm to prioritize content with higher engagement metrics over verification status to ensure content quality drives visibility.
Business Impact: This would enhance user retention and platform engagement by surfacing more engaging, high-quality content, regardless of verification status.
Expand Influencer Collaboration Beyond Verified Accounts:
Recommendation: Marketers should explore partnerships with both verified and non-verified creators who demonstrate strong engagement, ensuring they reach a diverse and active audience.
Business Impact: This strategy can lead to more effective influencer marketing campaigns and higher returns on investment.
3. Words that Win: Can Positive or Negative Captions Impact Your Video’s Reach?
It's often assumed that positive captions lead to more engagement on TikTok, as people generally respond better to uplifting or encouraging content. However, negative or even controversial captions can also drive significant interaction, especially in the form of comments or shares. In this analysis, we aim to test whether sentiment—positive, negative, or neutral—has a statistically significant impact on engagement metrics such as views, likes, shares, and comments.
By examining this data, we’ll uncover whether the assumption holds true or if there are other sentiment-based strategies that could be more effective in driving engagement.
Sentiment Analysis
The goal is to categorize each video caption into positive, negative, or neutral sentiment and analyze how these categories affect engagement.
For this analysis, video captions were processed using natural language processing tools to assess their sentiment. Each caption was evaluated and assigned a sentiment score that categorizes the text as positive, negative, or neutral. The sentiment analysis was powered by VADER (Valence Aware Dictionary and sEntiment Reasoner), a lexicon and rule-based sentiment analysis tool that is specifically attuned to sentiments expressed in social media.
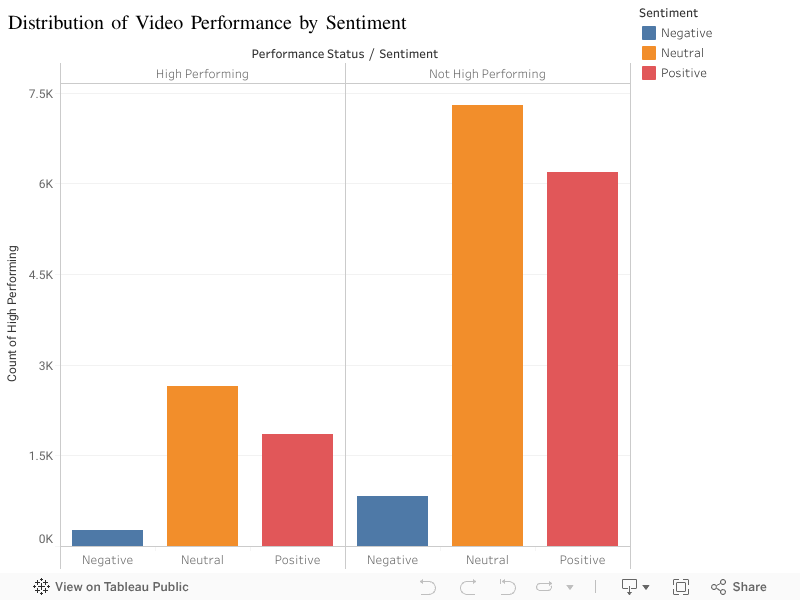
Note: Just like earlier, we categorized videos as "high performing" based on having at least one engagement metric (views, likes, shares, comments) in the top 25th percentile compared to all other videos
Visual Insights:
Key Observations:
Disparity in Performance: Consistent with previous insights, the overall number of not high-performing videos substantially exceeds that of high-performing videos across all sentiment categories, underscoring the challenge of achieving high engagement.
Sentiment Impact: Positive videos tend to perform better than negative ones, suggesting that positivity may be more engaging for viewers. However, it's notable that videos with neutral sentiment achieve even higher counts of not high-performing videos, potentially because a neutral tone might engage a broader spectrum of viewers by not leaning strongly towards either positive or negative emotions.
Speculative Insight:
The unexpected prominence of neutral videos, especially among not high-performing ones, might indicate that while neutral tones fail to generate peak engagement levels, they possibly maintain moderate interest across a wider audience. This broad appeal could lead to higher overall engagement but lower peak performance, an aspect worth exploring in further studies.
Statistical Analysis
Chi-square Test Analysis on TikTok Video Performance
Methodology: Using Python and the scipy.stats module, we conducted a Chi-square test on standardized engagement metrics (views, likes, shares, comments) to define high performing videos.
Key Findings:
Chi-square Statistic: 30.083, indicating a significant discrepancy between observed and expected frequencies.
P-value: 2.93e-07, strongly suggesting sentiment influences video performance.
Degrees of Freedom: 2, derived from three sentiment categories and two performance levels.
Expected Counts: Valid across all categories, affirming test reliability.
Conclusion: Sentiment significantly impacts TikTok video performance, highlighting the importance of caption tone in content strategy. In summary, the statistical confirmation that sentiment significantly affects video performance on TikTok provides a robust basis for refining content strategies, ensuring they are data-driven and aligned with audience preferences and behaviors. This integration enhances the analytical depth of your study, making it invaluable for practical applications and future investigations.
Further Analysis Preview:
To delve deeper into these dynamics, we will next examine box plots for each engagement metric—views, likes, shares, and comments. These visualizations will help clarify which specific metrics are most influenced by sentiment and how they contribute to a video’s performance status.
By analyzing these metrics individually, we aim to uncover more granular insights into how different emotional tones impact viewer interaction and engagement.
Metrics Analysis by Sentiment
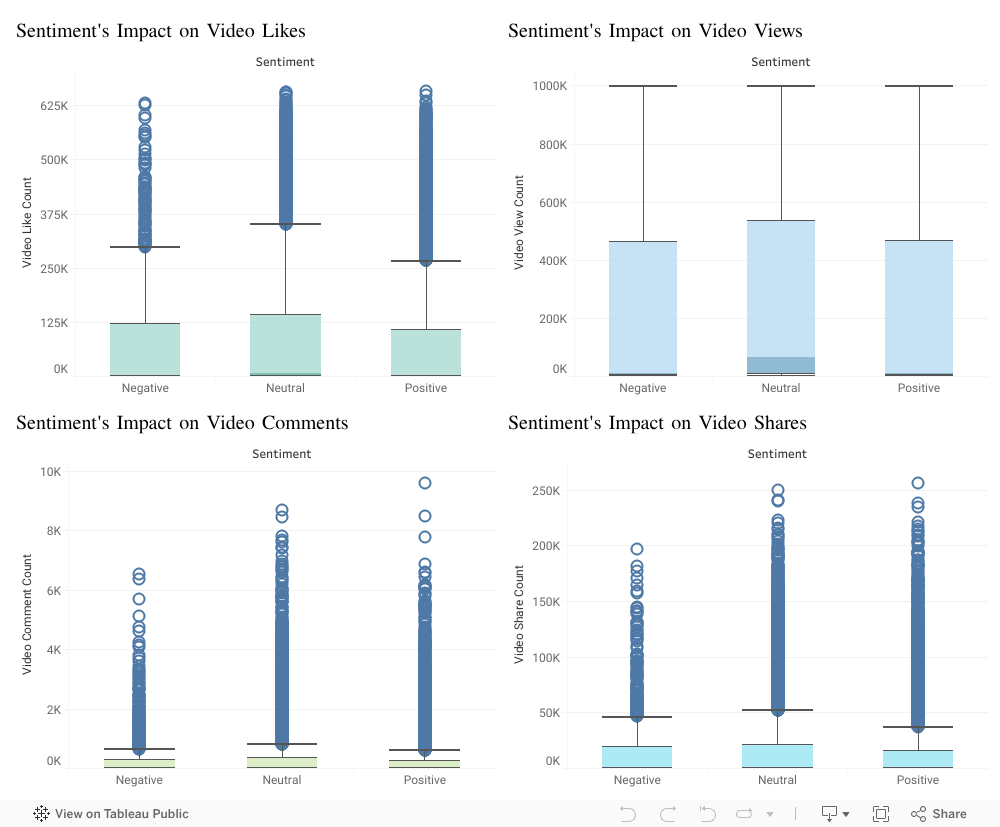
As we explore the impact of sentiment on video performance, it is crucial to understand not just whether videos are high-performing but also how different engagement metrics contribute to this status.
This analysis will help us see which of these metrics are most sensitive to the sentiment expressed in video captions and how they individually correlate with video performance.
Key Insights from Box Plots:
Likes: Neutral captions garner significantly more likes, with a median of 7,698, which is much higher than that for positive (2,637) and negative (3,011) sentiments. This suggests neutral captions' broad appeal and less polarizing content engage a wider audience effectively.
Views: Videos with neutral captions achieve markedly higher views, with a median of 63,837, far exceeding the medians for negative (9,794.5) and positive (9,218) sentiments. This indicates a general preference for content that avoids polarizing sentiments, thus attracting larger viewership.
Comments: Neutral sentiment leads to the most significant engagement in comments, with the highest median (13) and substantial variability, suggesting these videos can occasionally trigger substantial viewer interaction and debate.
Shares: Neutral captions also dominate in shares, with a median of 965, compared to 680.5 for negative and 546 for positive sentiments. The broad and less polarizing nature of neutral captions likely contributes to their higher shareability.
Consolidated Observation:
Neutral sentiment consistently leads across most engagement metrics, underlining its capacity to attract and engage a diverse audience without resorting to emotional extremes. This broad appeal is pivotal for strategies aimed at enhancing viewer interaction and maximizing content reach. Positive sentiments, while effective in generating likes, do not match the overall engagement breadth that neutral sentiments achieve.
These concise insights reflect the distinct impact of sentiments on engagement metrics, emphasizing the effectiveness of neutral captions in broadening audience reach and interaction. If you need further adjustments or additional focus on specific data aspects, please let me know.
Conclusion
The analysis demonstrates a significant relationship between the sentiment of video captions and their performance across various engagement metrics on TikTok. Neutral captions consistently outperform both positive and negative sentiments, leading to higher median values in likes, views, shares, and comments. This suggests that a neutral tone can attract a wider audience without polarizing viewers, thereby enhancing overall engagement. The statistical validation provided by the Chi-square test, with a p-value of 2.93e-07, confirms that different sentiments do significantly impact video performance, emphasizing the role of caption tone in content strategy.
Strategic Recommendations
Optimize Content Strategy with Neutral Tones: Given their broad appeal, integrating neutral tones in video captions should be a core strategy to maximize audience engagement. This approach can help brands and marketers reach a wider demographic without alienating segments of the audience, enhancing overall viewer retention and interaction rates.
Data-Driven Content Personalization: Employ sentiment analysis to personalize content strategically for different audience segments. Utilizing neutral tones generally enhances engagement, but exploring the nuanced impact of sentiment on specific demographic groups can enable targeted marketing strategies that resonate more effectively with each segment.
Implement A/B Testing for Strategic Insights: Regular A/B testing of caption sentiments against engagement metrics should be institutionalized to refine content strategies continually. This practice not only validates the effectiveness of different tones but also adapts to evolving audience preferences and behaviors, ensuring that marketing efforts remain agile and data-informed.
Advanced Analytical Tools Integration: Enhance content strategy frameworks by integrating advanced sentiment analysis tools to evaluate the potential impact of video captions pre-release. This proactive approach allows for adjustments based on predictive analytics, aligning content releases with expected viewer engagement patterns.
Invest in Analytics for Competitive Advantage: Encourage investment in developing proprietary analytical tools or enhancing existing platforms to gain deeper insights into content performance. This can provide a competitive edge by enabling more precise adjustments to content strategies based on data-driven insights, ultimately driving higher engagement and business growth.
Conclusion: Navigating the Future of TikTok Engagement
Our in-depth analysis has upended several longstanding myths about what drives engagement on TikTok, providing new insights that challenge traditional content strategies. By examining factors such as video length, verification status, and sentiment in video captions, we have identified key areas where current practices may not align with the most effective engagement strategies.
Strategic Insights and Implications for Companies:
Content Over Conformity: We found that neither video length nor verification guarantees higher engagement. Companies should encourage their teams to prioritize content creativity and authenticity over fitting a certain mold. This shift could foster more innovative and engaging content that resonates with a diverse TikTok audience.
Algorithm Adjustments: For tech companies and the TikTok platform itself, our findings suggest a reevaluation of the content recommendation algorithms. Incorporating metrics that better capture user engagement derived from content quality and sentiment analysis may enhance user experience and increase platform engagement.
Broadening Audience Engagement: The effectiveness of neutral sentiments in captions reveals a significant opportunity for companies to craft messages that appeal to a broader audience. This approach can be particularly valuable in campaigns aimed at building brand awareness and customer base expansion.
Corporate Strategy Recommendations:
Enhance Analytical Capabilities: Companies should invest in robust analytical tools that can dissect user engagement in real-time, allowing them to quickly adapt content strategies based on actual performance metrics rather than presumptions.
Diversify Content Production: Encourage content teams to experiment with diverse video formats and sentiments, moving beyond standard templates. This could involve setting up dedicated innovation labs within the company to test new ideas without the pressure of immediate ROI.
Strategic Content Partnerships: Companies should consider collaborations not just with verified influencers but also with emerging content creators who demonstrate high engagement metrics. This approach can tap into novel audience segments and deliver fresh perspectives to the content mix.
Conclusion: Our analysis provides a roadmap for companies looking to enhance their strategic engagement on TikTok. By understanding the nuances of what truly drives user interaction, companies can better position themselves to thrive on this dynamic platform. As TikTok continues to evolve, so too should the strategies that companies employ to capture and retain user attention. This study serves as a catalyst for such evolution, urging companies to leverage data-driven insights to forge deeper connections with their audience.
Resources
Dataset:
TikTok Dataset for EDA, Statistical, and Predictive Modelling, sourced from Kaggle:
https://www.kaggle.com/datasets/raminhuseyn/dataset-from-tiktok
Tools & Platforms:
Google Cloud SQL: Used for data storage, cleaning, and query optimization.
Mode Analytics: Utilized for SQL-based analysis, data visualization, and exploratory data analysis (EDA).
Google Colab: Used to run Python code to retrieve statistical values and sentiment analysis.
Tableau: Used to create interactive visuals.